


PIX Connect: Cómo exportar el diagrama temperatura-tiempo
Este vídeo explica qué datos de medición pueden obtenerse y cómo pueden exportarse a Excel u otros programas.
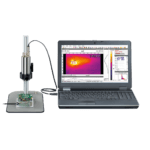
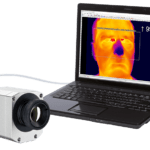
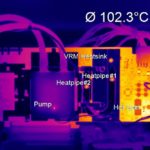
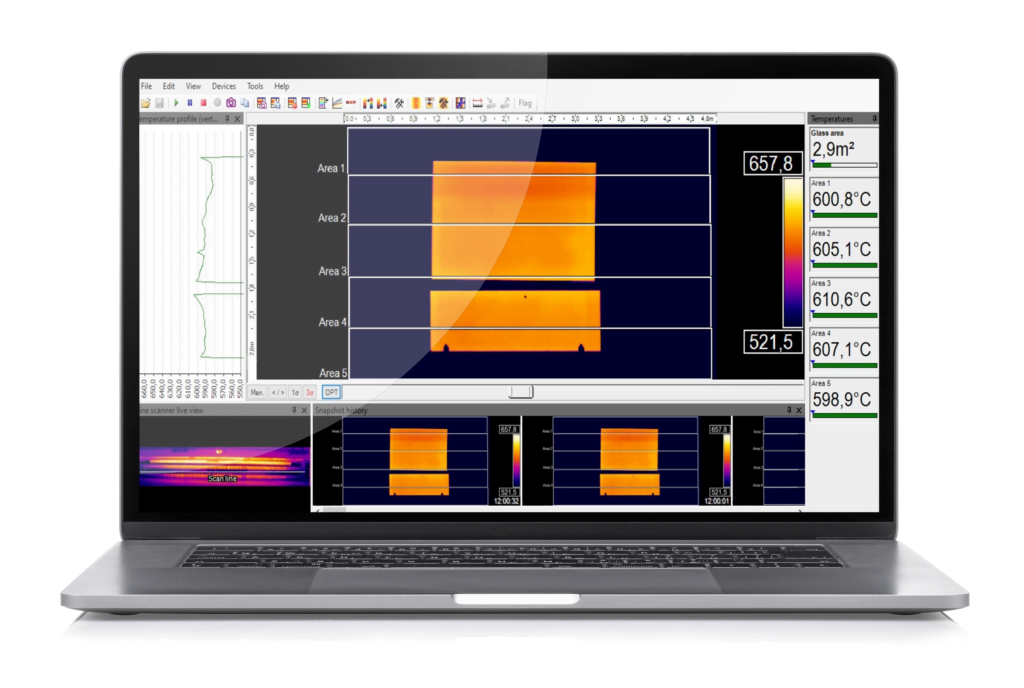
En la configuración de prueba, se registran con el software tres objetos con diferentes campos de medición de temperatura. Para la visualización, el software permite la representación en un diagrama temperatura-tiempo. Los datos visualizados se capturan por completo y pueden guardarse individualmente. A continuación, los datos pueden abrirse en Excel y otros programas. Además, se muestra cómo pueden visualizarse los datos de Excel en un gráfico 3D.
Descargas
Productos mencionados


Contacto para asesoramiento y ventas en todo el mundo
Le ofrecemos asesoramiento completo para sus aplicaciones individuales
Nuestros experimentados ingenieros de aplicaciones garantizan un servicio al cliente competente y fiable sobre el terreno. Además, Optris colabora estrechamente con numerosos socios distribuidores de todo el mundo.
Internacional
Ferdinand-Buisson-Str. 14
13127 Berlin, Germany
Teléfono: +49 (0)30 500 197-0
E-Mail: sales@optris.com
Internet: www.optris.com
Director General:
Dr.-Ing. Ulrich Kienitz
